The average U.S. household consumes roughly 43.5 hours of video each week according to a recent research report from Parks Associates, an increase of more than six hours from 37.2 hours in 2020. The report, titled The Viewer Journey: Navigating Streaming Options, explores how viewers navigate to video content across a variety of mediums including broadcast, traditional pay TV, and streaming video models.
The report includes analysis and insight from consumer surveys of 8,000 and 10,000 internet households in the US.
“Video-viewing households report watching on average more than 21 hours per week on a TV, accounting for half of their viewing hours,” said Sarah Lee, Research Analyst, Parks Associates.
“Video consumption on a cell phone continues to rise—excluding social video sources, US internet households spend 6.5 hours per week watching video a smartphone and 3.9 hours on a tablet. TVs are still the main video-viewing device, but platform usage continues to diversify.”
Additionally, 61% of households watch paid streaming services on a TV set, consuming an average of 7.5 hours per week of content from these services.
The research also found that 50% of people who consume video on a viewing device (TV, computer, tablet, or phone) watch a free, ad-supported service (FAST) or ad-based video on-demand service (AVOD) at least once a week.
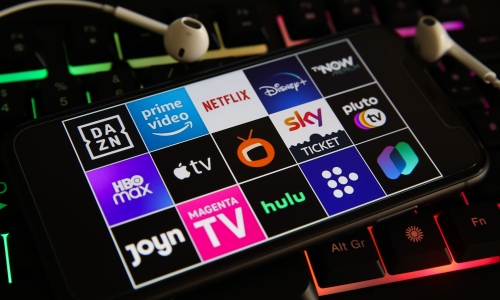
Ultimately, the report found that paid streaming services are still the most popular content type being consumed across TV, mobile, computers, and tablets. These households also shift between several different types of services across their devices over the week.
Seventy-eight percent of households report watching a subscription-based online video (SVOD) service weekly. Following close behind, 67% of households say they watch user-generated content such as that from YouTube.
This falls in line with a report from Parks Associates published in October 2023 that found many consumers have been cutting back on paid streaming services, with the annual churn rate for services like Netflix and Disney+ sitting at 47% as household spending on subscriptions have declined by 25% compared to 2021 numbers.
“The flexibility and convenience that on-demand services offer is highly appealing to viewers, but many households enjoy a balance between finding something to watch and watching what they find,” Lee said.
“Given the popularity of FAST and user-generated content, consumers may soon decide they do not need to subscribe to as many services as they do now.”


