Custom electronics integrators are diversifying their businesses more than ever to include a mix of both residential and light commercial applications. Indeed, 41.7% of integrators’ revenues last year came from commercial projects.
That percentage is the highest it’s been since CE Pro has been conducting its annual State of the Industry surveys, and it is an amazing near-10% jump from the previous year when 32.5% of revenues came from bars, restaurants, corporate offices, retail digital signage and other such projects. Prior to the recession, less than 20% of integrators’ revenues were earned via commercial projects.
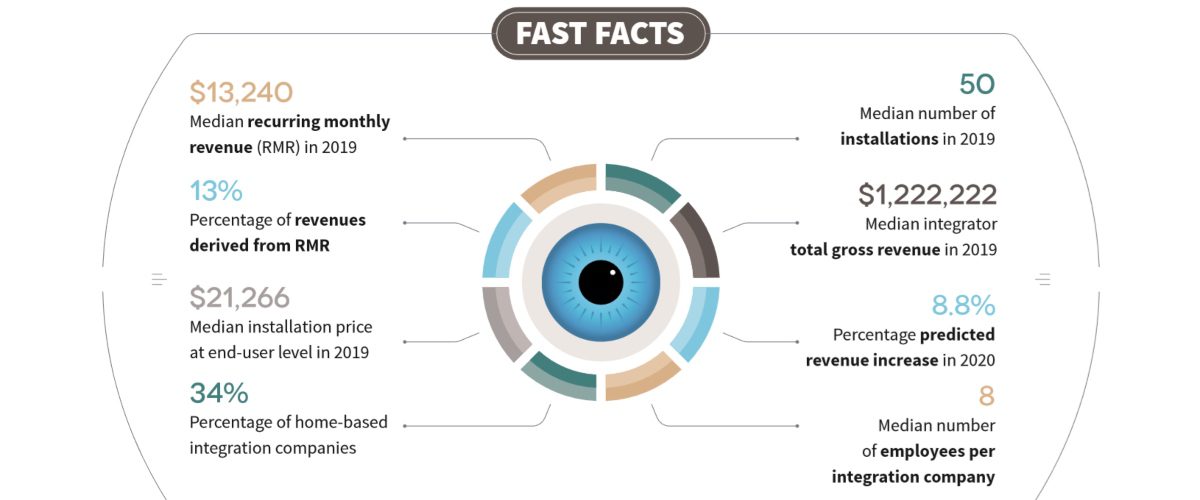
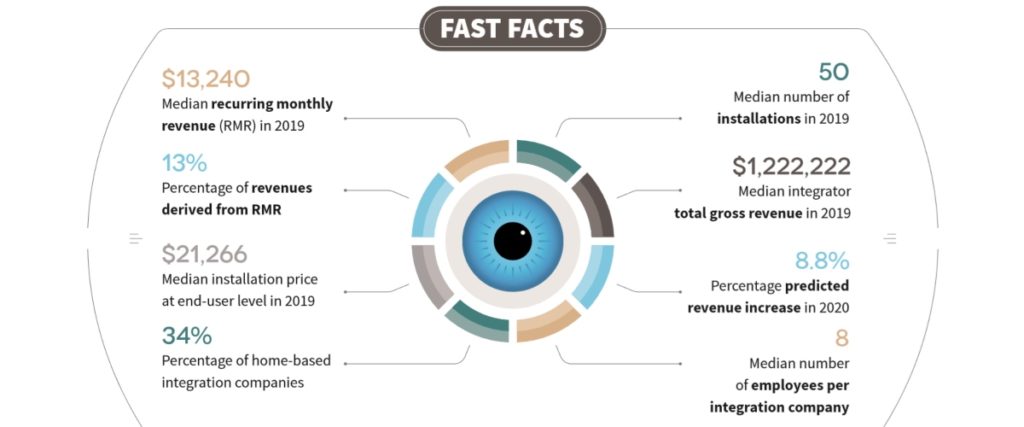
Those commercial projects were likely strong contributors to the 2019 revenue growth of 4%. The average custom integration company reports earning a median income of $1,222,222 from all sources, including installations of commercial and residential projects, service/maintenance fees, recurring monthly revenue (RMR) from service and monitoring, and design/ consulting fees.
Those data points are just some of the important trends gleaned from the 2019 CE Pro State of the Industry Study. The research, which was conducted in November and December 2019, had 246 usable respondents, representing a strong cross-section of the custom electronics market.
Projects Numbers Up, Prices Down
There are some other notable trends from this year’s survey. Namely, for the first time in three years, the median number of projects went up. Integrators report doing 50 projects in 2019. That is up from 45 projects in 2018 and 48 projects in 2017. But 50 projects per company per year is not unknown territory. Back in 2016, integrators reported installing 50 projects during the year.
As always, CE pros remain as optimistic as Little Orphan Annie was about tomorrow. On the whole, integrators predict 8.8% revenue growth in 2020. Heading into 2019, dealers were anticipating the identical growth percentage of 8.8%. Given that the year ended up with a 4% upswing, it means CE pros were clearly over-optimistic.
However, that is a common thread. Even in the depths of the Great Recession when revenues fell 51% in 2009 and 4% in 2011, survey respondents were predicting growth. The growth rate of 4% represents the lowest annual growth rate for the industry since 2011, when median revenues actually fell by 4% at the tail-end of the country’s downturn.
Employment and the labor shortage have definitely affected the industry over the past several years. One reason that many integration companies reported they did fewer projects in 2017 and 2018 was due to the lack of skilled labor.
Without the manpower on hand, dealers were forced to be very selective about the projects they did. So, they took on higher-priced projects but did fewer of them. Thus, the median number of employees had held steady between 6 and 7 for the past several years. But in 2019, integrators appear to have bitten the bullet and hired additional staff. The median number of employees rose to 8 last year.
Diverse Sources of Revenue
As noted, the median price of an installation fell in 2019 to $21,266, down from $26,060 the prior year. The demand for professionally installed systems has never been higher, so with the added manpower, it appears CE pros decided to take on more projects last year than they have in the past.
Overall, integrators report performing a mix of big projects and small projects in 2019. In total, 12% of all projects undertaken were more than $100,000, while 7% were less than $1,000.
The diversity of the market is also apparent when looking at the percentage of integration companies who say they did at least one project last year in various types of residential, commercial and even government sectors.
Residential single-family, new construction custom-built homes are still the bread-and-butter for dealers with 86% of dealers working in that area, but nearly three out of every four dealers also worked in existing homes. It is of interest to note that dealers also reported 53.8% of their revenue comes from remodeling jobs. Meanwhile, almost half of dealers (44%) did at least one new construction commercial project last year, and 3% of integrators were involved in government work in 2019.
For the first time, the survey asked about dealers’ primary business location. The most common home base of operations is a commercial office with some type of appointment-only showroom, with approximately one-third of custom electronics companies (32%) based out of that type of location. The survey did not delve into showroom square footage.
Nearly one-in-four integrators (23%) are based in home offices with no showroom, while another 11% of dealers actually use their own home as a showroom. Retail is still somewhat popular, with 16% of CE pros opening their showroom for retail hours available to walk-ins.
For many years, the custom electronics integration companies relied on both revenues and profits from equipment. But that appears to be changing somewhat.
The influx of DIY solutions on the market have limited dealers’ ability to mark up the equipment, eating away at margin and profit. Likewise, the DIY solutions have given consumers a false impression on what it should cost to have a truly integrated home solution from a professional installer, which puts downward price pressure on labor rates.
Thus, the survey aimed to collect some hard numbers behind the trend. First, integrators report that 39% of total revenues are driven by equipment costs. That is lower than the long-held belief that dealers can earn half of their revenue from equipment.
Likewise, CE pros report they earn 31% profit on equipment. Again, that percentage is lower than the industry golden years when dealers sold unknown brands that did not have MSRPs to clients and often doubled the dealer cost when selling to the consumer.
Meanwhile, custom integration companies report earning approximately one-fourth of their revenues (26%) from installation labor, 13% from service and 12% from design and programming fees. On the profit side, each of those areas generates about the same level of profit, with installation labor eking out the most (36%) followed by service labor (35%) and design fees at 31%.
Recurring revenue continues to be a growing trend in the industry. For the fifth year in a row, integrators report that the percentage of their revenue from RMR has risen. (The acronym RMR for recurring monthly revenue is used to designate recurring revenues, whether it is billed monthly, quarterly or annually.)
In 2019, CE pros earned 13% of their total revenues in the form of RMR. Th at equates to $158,888 for the year, or $13,240 per month in RMR from service agreements, security monitoring, warranties, seat licenses for remote managed services, remote power management fees and cloud storage of video surveillance images.
Equipment Acquisition Trends
As always, some categories of equipment are hotter than others. For several years now, three categories of equipment have interchangeably been in the top spots of areas where dealers believe they will have the most demand.
For 2020, networking/IT equipment, 4K and 8K Ultra HD TVs and video surveillance cameras are the most in-demand areas. For years, displays were among the lowest growth categories for dealers, but 4K and 8K have led a revival over the past several years. LED lighting fixtures and video doorbells are also predicted to be big sellers in 2020.
The research also shows strong increases overall in certain broad categories of equipment, led by security. Dealers reported purchasing $89,535 (end-user MSRP) of security equipment in 2019. That is up a whopping 45% from 2018. Networking, home theater/video and audio equipment expenditures also all rose by more than 20% in 2019.
The only category where dealers spent less was home automation/controls. That decrease could be a reflection of the lower-cost entry point for whole-house automation, along with some integrators opting to offer decentralized control options to clients who don’t mind having a device loaded with individual control apps.
As home technology becomes more prevalent. Integrators are finding allies among various trades, as well as among homeowners. 2019 was no different. While CE pros remain the most influential decision-makers of product selection (the final decision-maker for 39.4% of products), homeowner requests for specific brands are becoming more frequent. The data reflects that nearly one-third of the time (29.7%), a product was selected because it was the choice of the end-user client. Other influencers include consultants (9.4% of products), along with interior designers (7.4%), architects (7.4%) and builders (6.7%).
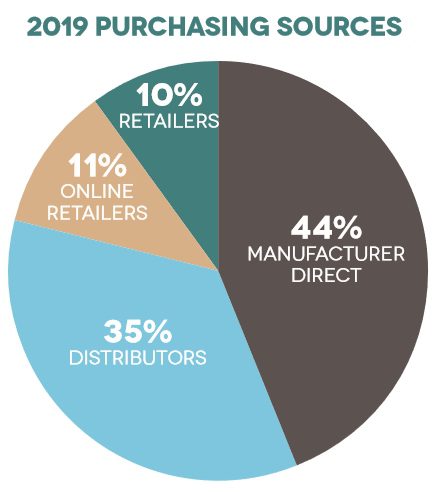
The way in which dealers purchase equipment is also changing. More dealers are buying direct from manufacturers than in recent years. This could be a reflection of improved manufacturer portals, an increased use of independent manufacturers’ reps in the industry, and a growing number of manufacturers choosing to employ their own direct sales teams.
Buying groups are also influential in this area — as more dealers join buying groups, then more products can be purchased directly. The percentage of product bought directly from a manufacturer in 2019 was 44%, up from 38% last year. Meanwhile, the number of products purchased via distribution fell from 48% of all buys to 35%.
Indeed, the days of dealers driving to the distribution outlet to buy products are shrinking. Integrators aim to maximize efficiency, which means buying products in advance electronically. Nearly half of all product purchases in 2019 were made via an electronic portal.
Lastly, challenges persist in the market. Not surprisingly, the labor shortage is cited as the biggest headache, and integrators are worried that a long-anticipated economic slowdown is on the horizon. But who knows — no one has perfect 2020 vision.
