HDMI rev 2.1 was announced in January 2017. The actual specification was not released until the end of that year. This allowed companies to begin the design process to move forward with what has become the greatest expansion to the interface.
But we still needed a test spec to ensure products could meet performance limits and work among millions of products out in the field (interoperability).
Historically, this has been accomplished by following CTS (compliance testing specification) guidelines. As always, nothing can happen until that document is released.
It took an additional year to do so, but then it was only for source and sink (display) products; wire and cable had not been completed… no doubt, one of the most important elements to the interface.
Demand was high, but with no wire and cable CTS interoperability became guesswork. Remember, this is a system environment; everyone has to play in the same sandbox.
Read Next: Power vs. Data Rate— Is There a Compromise?
For months we’ve been seeing 48G HDMI cables enter the market place with no real verification except for internal testing by some manufacturers using insertion loss. We may not know until these products are used with real 48G content how well they fair, which could be a long way out.
What's the Deal With Self-Testing?
So what’s going on? If self-testing is being used, then to what standards are they measured against?
It was easy to self-test insertion loss (similar to frequency response) many moons ago because performance limits were readily available.
Take radio frequency (RF); do some frequency response measurements and you are there.
One method is the use of S-Parameters, particularly SDD21 insertion loss. But when jumping to high-speed digital signaling like HDMI we entered into the microwave category. In this world electrical physics takes on new meanings like parasitic, capacitance and inductive anomalies.
Digital testing has historically used some form of bit analysis viewing the signal via an eye pattern analysis. It is one method that has been used for high-speed digital testing and debugging, including HDMI, throughout the electronics community. Eye patterns tell a story; insertion loss shows one event.
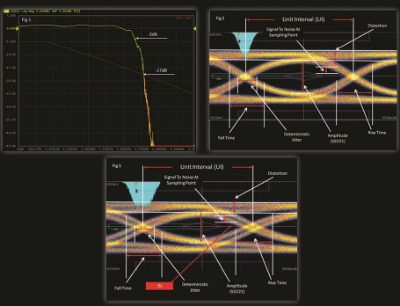
Fig 1 shows a typical SDD21 curve. The roll-off point historically has been 3dB. Here we are looking at data rates into the microwave category.
The frequency response of this particular transmission takes on a new look, showing the response to be a little over 3.5GHz … and that’s all you get from the test.
Now check out the first eye pattern in Fig 2; the amount of data gathered from this one shot tells the entire story.
Fig 3 is the same signal only through a randomly picked AOC hybrid optical cable rather than copper. Notice in Fig 3 the addition of the early stages of ISI (inner symbol interference), which occurs when one symbol (bit) interferes with another.
This can be caused by multiple reasons, one being impedance. This would have been missed if it were not for an eye pattern measurement.
There are other methods to determine signal performance by way of stress analysis testing.
DPL uses this religiously. We can induce stress into a system by simulating complex signals and re-run the routine to measure how well they perform under less-than-perfect conditions using an AWG (arbitrary waveform generator).
A stress analysis can be induced into a host of samples to predict performance under some real-world conditions. These tests can be requested to offer the manufacturer even more data.


