It’s official: cable manufacturers worldwide now have available to them the necessary tools and test instruments designed specifically for mass-production cable houses. High Speed Digital Video cable producers have never had the ability to actually capture these high data rates in real-time during final production testing. Historically, factories have either produced cables with continuity testing or — if they were really good — they would run the product up on a display and the operator would watch cartoons all day. With 48G banging at our door, the need to elevate to the next level is imperative.
But why, and why now? It’s simple — the new specification for 8K has extended the operating envelope substantially and with that an increased number of features is becoming available from the interface.
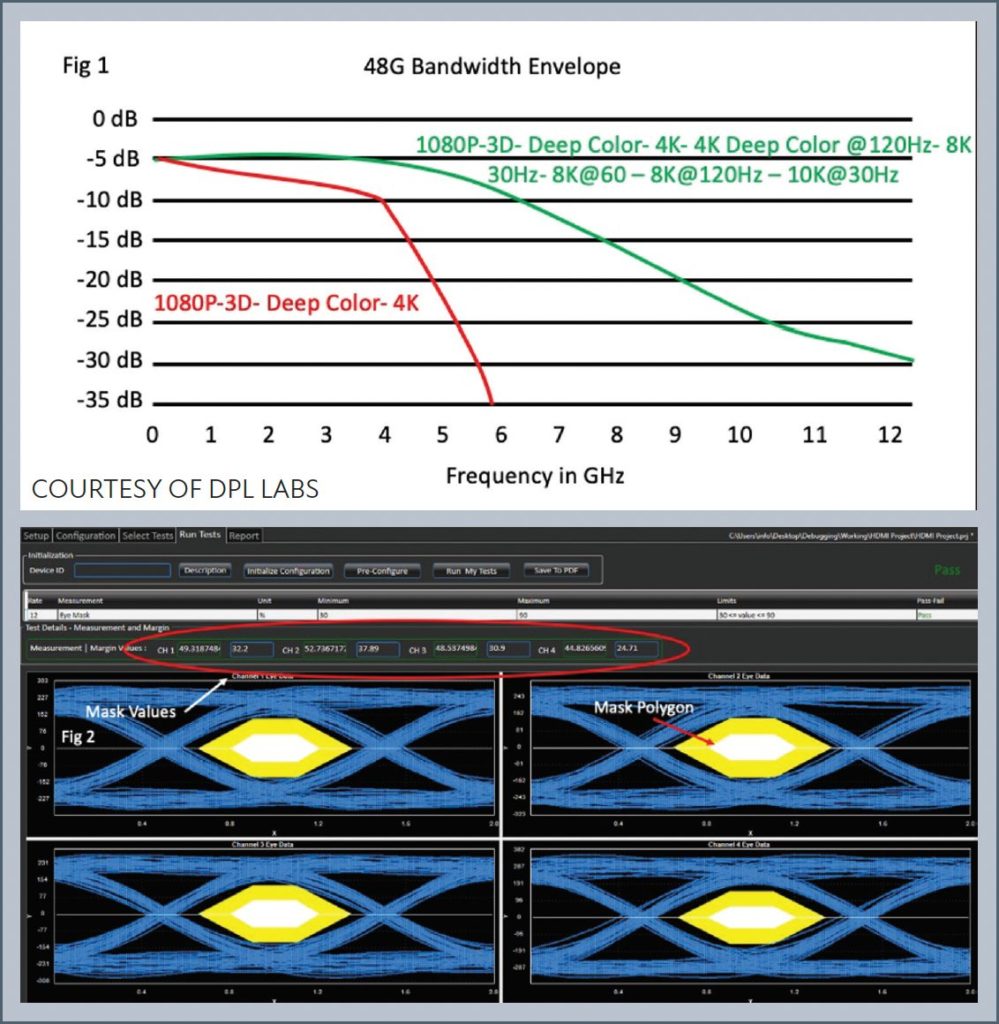
The response curve chart in Fig. 1 provides an easy way to understand how dynamic the response is. Green line is 48G 8K and red line is 18G 4K. Listed (in green) are just some of the features inside each format. We have pretty much lived in the 10G to 18G space, but under 48G we need all that plus the additional data rates to get us to 8K and 10K. This is all doable providing the cable producers have done their homework. Take note of the curves and how the signal attenuates as the frequency gets higher. As we have learned so many times, these curves do not necessarily have the tendency to offer a natural and smooth roll off.
Even comparing cables from the same dye lot and build, there are differences. This is why we have always relied on Time Domain measurements and Eye Pattern diagrams to verify integrity.
In a production facility where they construct thousands of cables every day, the chances of experiencing differences are even greater, which certainly cannot provide peace of mind for branded cable companies. But now with full Time Domain production testing and the ability to add in some generated signal stress, operators can achieve easy and accurate results.
Notice all four video channels are displayed at the same time in Fig. 2. Some may do fine with all four channels but others, as we know, can fluctuate. In these cases, by increasing the stress on each device even low-quality channels can be identified very quickly if the device is truly ready for delivery. Eye diagrams in Fig 2 are all performing very well.
Notice the yellow area in the waveform. This is known as the Mask Margin. It displays the amount of “safe zone” area each channel offers. The larger the safe zone, the better the performance. It is numerically read on the screen where it is circled in red. In Fig. 2 there are as much as 10% differences between channels. These are strong channels up toward the 50% level providing excellent distancing, but other products may only hover between 5% to 15% as a norm. Now factor our 10% differences and you can see how things can go south very quickly. Understanding these numbers allows for even more scrutiny when testing each device.
This new production process has generated lots of excitement among manufacturers. They can now differentiate because some will practice these new techniques and some won’t. Price has always been the motivator, but when it comes to 48G with 8K and 10K resolutions this will change. Now price, reliability and performance can all hold equal weight when deciding what cable to buy.


